Measure the variation that matters—not every location equally.
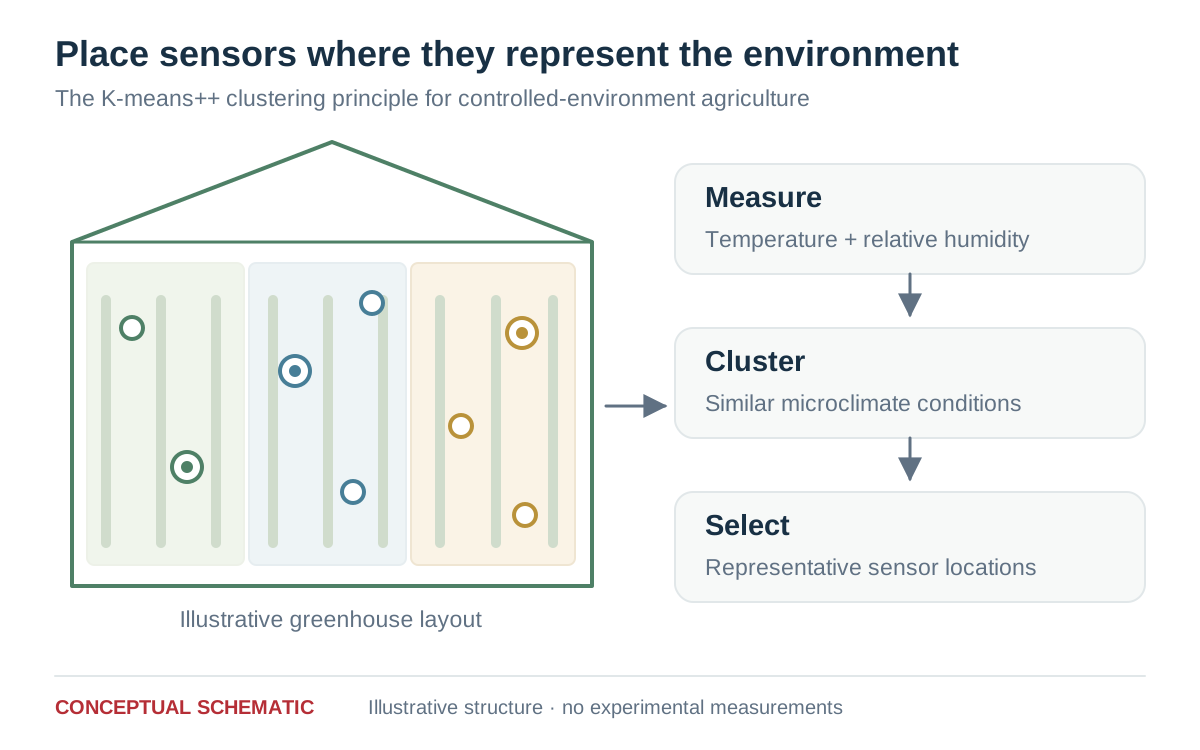
Conceptual illustration of sensor clustering: collect temperature and humidity data, group similar conditions, and identify representative sensing locations. Uyeh et al., Computers and Electronics in Agriculture (2022).
View full figureThe Question
If a greenhouse has 56 sensor locations, how do you find the minimum set that captures meaningful variation without redundant monitoring?
My Contribution
Online K-Means++ clustering, psychrometric feature construction, multi-season validation.
What the record shows
Demonstrates reliable microclimate estimation from a reduced sensor footprint, lowering deployment costs.
What this does—and does not—establish
Optimizes sensor placement for specific geometries and seasons; re-calibration may be necessary for structural changes.
Resources
Continue exploring
Publication record
An online machine learning-based sensors clustering system for efficient and cost-effective environmental monitoring in controlled environment agriculture
Daniel Dooyum Uyeh et al. · Co-author: Abraham Osinuga. Computers and Electronics in Agriculture 199: 107139, 2022.